The Thomson Reuters/Core CRB Commodity Index is the standard commodities index market analysts look to in order to gauge the strength of the overall commodities market. It was first introduced by the Commodity Research Bureau in the 1950’s (hence the shorthand, CRB). The CRB Commodity Index is comprised of soft commodities, energy, grains, precious and industrial metals, and meats.
In all, the index is a broad gauge of the commodity sector as it runs the gamut across all commodities markets.
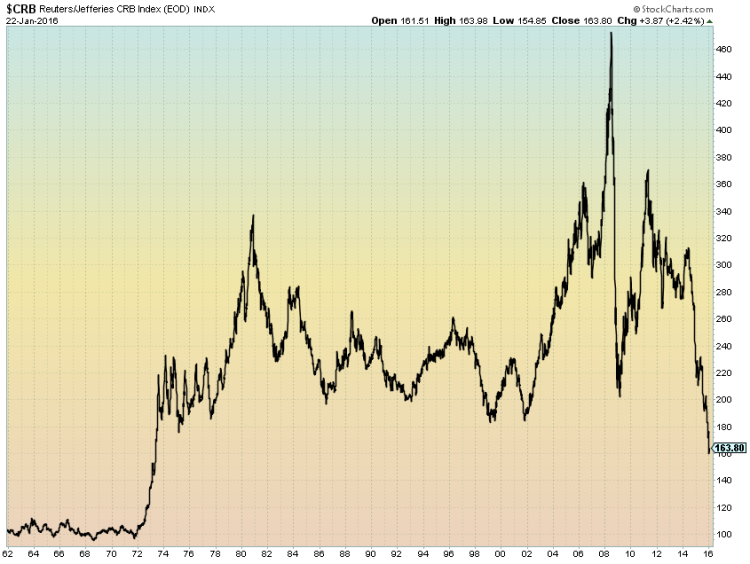
2016, though only 3 weeks in, has seen a continuation of the sharp selloff that gained legs in the summer of 2014. The CRB Commodity Index has now fallen to levels not seen since May 1973!
The chart below rather clearly tells the story in the commodities markets in recent years – the bull run from 2002 through the peak of bullish speculation in 2008, followed by the global commodity selloff induced by the great recession in the latter half of 2008. The hot ‘reflation’ and central bank intervention trade of 2009 through early 2011 took the CRB Index from 200 to about 370, but that rally was followed by a few years of mildly declining commodity prices from mid-2011 through early 2014.
That then brings us to the severe bear market in the last 18 months, with the CRB Commodity Index dropping a whopping 50% from the 2014 peak to last week’s low of 155. I am not sure of the value of performing technical analysis on an index which is not really traded in itself, but the 100-120 level was where the CRB Commodity Index meandered for much of its first 15 years of existence from the late 1950’s to the early 70’s.
CRB Commodity Index Price Chart (1962-2016)
Thanks for reading.
Twitter: @MikeZaccardi
No position in any of the mentioned securities at the time of publication. Any opinions expressed herein are solely those of the author, and do not in any way represent the views or opinions of any other person or entity.


