Advance-decline data across the board has looked impeccable for over a year.
In theory, it leads the stock market to new highs.
Obviously, so far it hasn’t as the downside included a 20 percent drop in the S&P 500.
Maybe there are some factors like increased buybacks or program trading that makes this data look so good, but it’s not helpful to speculate without hard data.
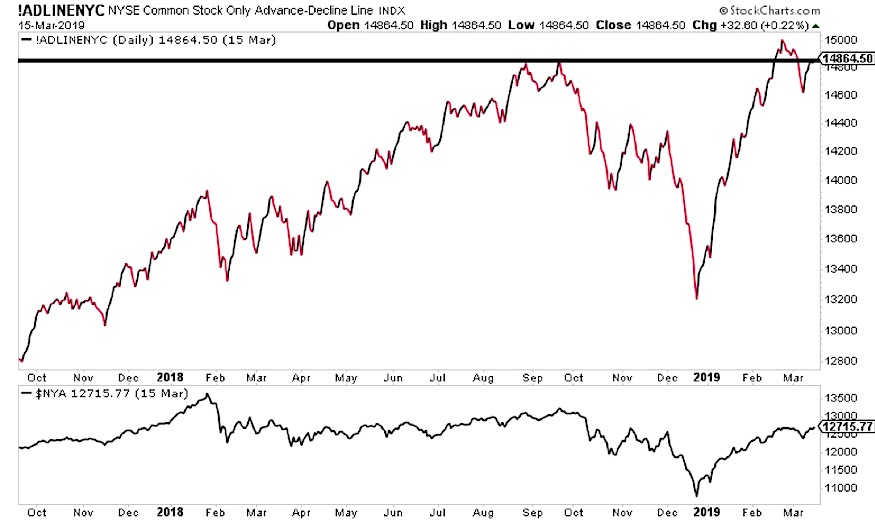
Below is a look at the broadest measure of advance-decline line breadth, the NYSE stock only Advance-Decline line.
A simple failure to hold new highs in breadth marked the top in the NYSE in the fall. Now, breadth is notably diverging from price after a massive rip while it has stopped right at that old September high area. Needless to say, bulls don’t want to see this roll over.
We have evidence of both a longer term bullish sign with a shorter term caution sign. Thus, it seems prudent to be aware of downside risks now while keeping in mind the longer term framework, supporting an eventual move to new highs.
Thanks for reading. Trade ‘em well!
Twitter: @ATMcharts
Any opinions expressed herein are solely those of the author and do not in any way represent the views or opinions of any other person or entity.


 Rally Price Targets")
 Rolling Over At Key Fibonacci Level?")


